- Solar Guides
How Much Power Does a Solar Panel Produce? Daily, Monthly & Yearly Output (2026)
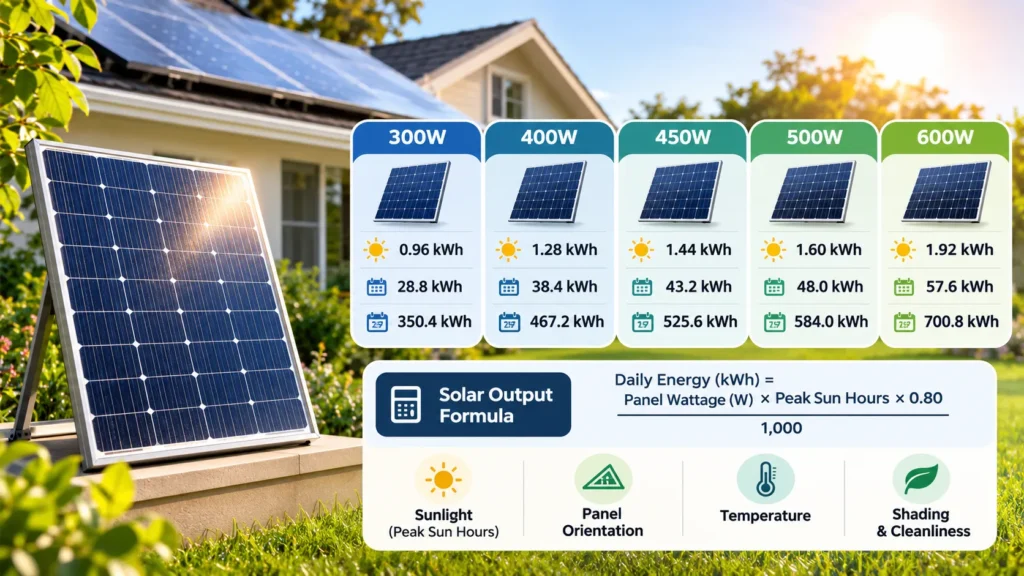
How much power does a solar panel produce? Most residential solar panels installed today have power ratings of approximately 400 to 460 watts (W). Under an illustrative scenario with four peak sun hours per day and an 80% overall energy-delivery factor, a 400W panel generates around 1.28 kilowatt-hours (kWh) of electricity daily, or approximately 38.4 kWh over 30 days.
A 450W panel under the same conditions produces about 1.44 kWh per day, while a 500W panel produces around 1.6 kWh.
These are simplified estimates, not guaranteed production figures. Actual electricity generation depends on your location, weather, panel orientation, temperature, shading, and system equipment.
According to EnergySage’s October 2026 solar panel output analysis, approximately 97% of residential panels quoted through its marketplace during the first half of 2026 were rated between 400W and 460W.
Understanding the difference between a panel’s rated power and the electricity it generates is essential when comparing solar equipment or planning a home installation.
In this guide, you’ll learn how to calculate solar panel output per day, month, and year, compare panels from 300W to 600W, and estimate how much electricity your rooftop solar system could produce.
For a personalized estimate, explore our free Solar Production Calculator.
How Much Electricity Does One Solar Panel Produce?
A typical residential solar panel can generate roughly 1–2 kWh of electricity per day under many practical solar conditions, although actual output may fall outside that range.
The panel’s wattage is only one part of the calculation.
A 450W panel receiving strong sunlight in a favorable location can produce more electricity than the same panel installed on a shaded roof.
Likewise, a panel rated at 500W does not continuously deliver 500 watts throughout the day. Its instantaneous power changes as sunlight intensity, cell temperature, and other conditions change.
Quick Solar Panel Output Comparison
The table below compares common solar panel wattages using these illustrative assumptions:
Four peak sun hours per day
An overall energy-delivery factor of 80%
A 30-day month
A 365-day year
| Solar panel rating | Daily output | Monthly output | Yearly output |
|---|---|---|---|
| 300W | 0.96 kWh | 28.8 kWh | 350.4 kWh |
| 350W | 1.12 kWh | 33.6 kWh | 408.8 kWh |
| 400W | 1.28 kWh | 38.4 kWh | 467.2 kWh |
| 450W | 1.44 kWh | 43.2 kWh | 525.6 kWh |
| 500W | 1.60 kWh | 48.0 kWh | 584.0 kWh |
| 550W | 1.76 kWh | 52.8 kWh | 642.4 kWh |
| 600W | 1.92 kWh | 57.6 kWh | 700.8 kWh |
These are illustrative estimates based on constant average daily solar conditions. The monthly and yearly columns are calculated from the daily figures, not independently modeled using seasonal weather data.
A higher-wattage panel generally produces more electricity under comparable conditions, but the difference depends on how the panels perform in the real world.
Solar Panel Watts vs. Kilowatt-Hours: What's the Difference?
One of the most common mistakes when evaluating solar panels is confusing watts (W) with kilowatt-hours (kWh).
Although these measurements are related, they describe different things.
Watts Measure Power
Watts describe how much electrical power a device produces or consumes at a particular moment.
For example, a solar panel rated at 450W has a nominal maximum power rating of 450 watts under standard test conditions.
That rating does not mean it generates 450 watts continuously from sunrise to sunset.
Solar panel ratings are determined under controlled laboratory conditions, including solar irradiance of 1,000 W/m² and a cell temperature of 25°C (77°F).
Real rooftops rarely maintain those conditions throughout the day.
The U.S. Department of Energy explains how operating conditions affect photovoltaic performance.
Kilowatt-Hours Measure Energy
Kilowatt-hours measure how much electricity is produced or consumed over time.
For example, if a device consumes 1,000 watts for one hour, it uses:
1,000W × 1 hour = 1,000Wh
That equals 1 kWh.
Similarly, if a 400W solar panel could maintain 400W of output for four hours, it would produce:
400W × 4 hours = 1,600Wh
Or 1.6 kWh before accounting for any relevant losses.
In practice, solar output changes continuously, which is why solar energy estimates use solar-resource data and performance assumptions.
Power vs. Energy at a Glance
| Measurement | What it tells you | Example |
|---|---|---|
| Watts (W) | Instantaneous electrical power | 450W solar panel |
| Kilowatts (kW) | Power expressed in thousands of watts | 10kW solar array |
| Watt-hours (Wh) | Electrical energy | 450Wh |
| Kilowatt-hours (kWh) | Energy expressed in thousands of watt-hours | 1.5 kWh per day |
When comparing panels, look at their wattage ratings.
When estimating electricity bills, solar savings, or battery requirements, focus on kilowatt-hours.
How to Calculate Solar Panel Power Output
You can estimate solar panel electricity generation using a straightforward formula.
Daily Solar Energy (kWh) = Panel Wattage (W) × Peak Sun Hours × Energy Delivery Factor ÷ 1,000
For example, suppose you have a 450W solar panel installed at a location receiving an average of four peak sun hours daily.
Assume an overall energy-delivery factor of 0.80.
The calculation becomes:
450 × 4 × 0.80 ÷ 1,000 = 1.44 kWh per day
For a 30-day month:
1.44 × 30 = 43.2 kWh per month
For a 365-day year:
1.44 × 365 = 525.6 kWh per year
This provides a useful preliminary estimate.
However, professional solar production modeling is more detailed. It uses local irradiance data, module characteristics, temperature behavior, array orientation, inverter efficiency, and other parameters.
The PVWatts Calculator provides location-specific production estimates for grid-connected photovoltaic systems.
Step 1: Identify the Solar Panel Wattage
Check the manufacturer’s product specifications for the module’s rated maximum power.
For example:
350W
400W
450W
500W
If you already own a solar panel, its label or datasheet should list its rated power.
Step 2: Estimate Peak Sun Hours
Peak sun hours represent the equivalent number of hours of sunlight at an irradiance of 1,000 W/m².
They are not the same as total daylight hours.
A location with 12 hours of daylight might receive only four equivalent peak sun hours because sunlight is weaker in the early morning and late afternoon.
Local solar-resource data is more reliable than using a universal average.
Step 3: Account for Energy Losses
Solar panels and associated equipment experience performance losses from several sources.
These may include:
Shading
Dirt and dust
Wiring resistance
Inverter conversion
Module mismatch
Temperature effects
Equipment degradation
For the simplified examples in this guide, we use an 80% overall energy-delivery factor.
Important: This is an illustrative combined factor, not an official default for every installation.
PVWatts uses more detailed modeling. Its commonly used default includes approximately 14% miscellaneous system losses, while inverter efficiency and temperature effects are modeled separately.
You should not simply add every loss percentage together or apply temperature and inverter losses twice.
Step 4: Calculate Daily, Monthly, and Annual Energy
Once you know the panel wattage, peak sun hours, and assumed energy-delivery factor, calculate daily production.
Then multiply by the number of days in the period.
This is a convenient first estimate, but actual monthly production will vary throughout the year.
For a more realistic annual forecast, use monthly solar-resource data rather than assuming every day receives identical sunlight.
How Much Power Does a 300W Solar Panel Produce?
A 300W solar panel has a rated power capacity of 300 watts under standard test conditions.
With four peak sun hours and an 80% overall energy-delivery factor:
300 × 4 × 0.80 ÷ 1,000 = 0.96 kWh per day
That is approximately:
28.8 kWh over 30 days
350.4 kWh over 365 days
A 300W panel may be suitable for smaller solar installations, depending on the available space and energy requirements.
For example, it could contribute electricity toward lighting, electronics, or other household loads.
However, whether it can operate a particular appliance depends on instantaneous power requirements, inverter capability, available sunlight, and whether battery or grid power is available.
How Much Electricity Does a 350W Solar Panel Produce?
Under the same assumptions:
350 × 4 × 0.80 ÷ 1,000 = 1.12 kWh daily
Estimated generation:
Daily: 1.12 kWh
Monthly: 33.6 kWh
Yearly: 408.8 kWh
A 350W panel generates more energy than a 300W panel under otherwise identical conditions.
However, if two panels have different physical dimensions, comparing their wattage alone may not tell you which uses roof space more efficiently.
Panel efficiency and power density are also important.
How Much Power Does a 400W Solar Panel Produce?
A 400W solar panel is a useful reference point for residential solar calculations.
Under our example conditions:
400 × 4 × 0.80 ÷ 1,000 = 1.28 kWh per day
Estimated electricity generation:
| Period | Energy generated |
|---|---|
| One day | 1.28 kWh |
| Seven days | 8.96 kWh |
| 30 days | 38.4 kWh |
| 365 days | 467.2 kWh |
A household using 900 kWh per month would not meet that consumption with a single 400W panel.
To estimate the required number of panels, you would compare the home’s energy needs with the expected output of each panel, then account for the practical design of the full array.
Our guide on How Many Solar Panels Do I Need? explains that process in detail.
How Much Electricity Does a 450W Solar Panel Produce?
A 450W panel can produce approximately 1.44 kWh per day under the illustrative assumptions used throughout this article.
That equals:
43.2 kWh per 30-day month
525.6 kWh per 365-day year
For example, ten 450W panels create a 4.5kW DC solar array.
Their estimated combined daily generation would be:
10 × 1.44 = 14.4 kWh per day
Over 30 days:
14.4 × 30 = 432 kWh
The calculation assumes identical conditions for every panel and does not account for differences in individual panel shading or array configuration.
How Much Power Does a 500W Solar Panel Produce?
A 500W solar panel provides a higher rated output than a 400W or 450W panel.
Using four peak sun hours and 80% energy delivery:
500 × 4 × 0.80 ÷ 1,000 = 1.6 kWh daily
Estimated production:
Daily: 1.6 kWh
Monthly: 48 kWh
Yearly: 584 kWh
Ten 500W panels provide 5kW of rated DC capacity.
Under the same conditions, the array would produce approximately:
5 × 4 × 0.80 = 16 kWh per day
Higher-wattage panels can reduce the number of modules needed for a target system capacity, but their physical size, electrical characteristics, cost, and mounting requirements must also be considered.
How Much Energy Does a 600W Solar Panel Produce?
A 600W solar panel can generate approximately 1.92 kWh daily using the same example assumptions.
That equals:
57.6 kWh over 30 days
700.8 kWh over 365 days
However, many high-wattage modules are physically larger than typical residential panels.
A 600W panel is not automatically the best choice for every rooftop.
Homeowners should compare usable roof area, module dimensions, efficiency, inverter compatibility, installation requirements, and total system cost.
The most suitable panel is the one that fits the installation’s overall design—not necessarily the one with the highest wattage printed on its label.
How Much Solar Energy Can One Panel Produce in Different Sunlight Conditions?
Peak sun hours can substantially change the electricity generated by the same solar panel.
Consider a 450W panel with an assumed overall energy-delivery factor of 80%.
| Daily peak sun hours | Daily energy | Monthly energy |
|---|---|---|
| 2.5 hours | 0.90 kWh | 27.0 kWh |
| 3 hours | 1.08 kWh | 32.4 kWh |
| 3.5 hours | 1.26 kWh | 37.8 kWh |
| 4 hours | 1.44 kWh | 43.2 kWh |
| 4.5 hours | 1.62 kWh | 48.6 kWh |
| 5 hours | 1.80 kWh | 54.0 kWh |
| 5.5 hours | 1.98 kWh | 59.4 kWh |
| 6 hours | 2.16 kWh | 64.8 kWh |
These values are illustrative. Monthly output assumes 30 identical average days. Actual monthly weather and solar conditions vary.
The difference is significant.
At three peak sun hours, the panel produces approximately 1.08 kWh daily.
At six peak sun hours, the same panel produces approximately 2.16 kWh.
That is twice as much electricity under the simplified model.
This explains why location-specific solar production estimates are important.
What Factors Affect Solar Panel Power Output?
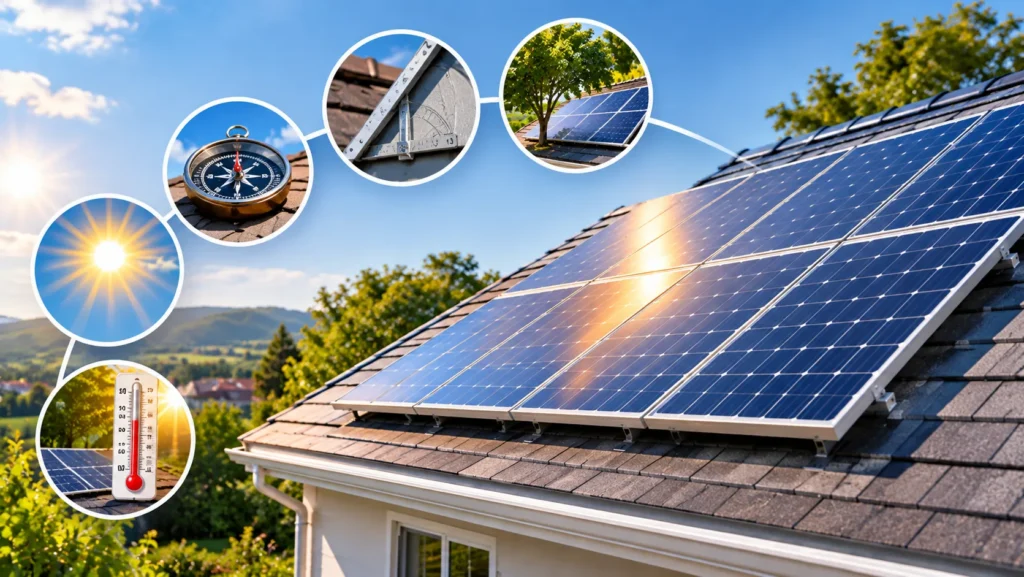
Two solar panels with identical ratings can generate different amounts of electricity because of environmental conditions and installation design.
1. Geographic Location
Solar resources vary by latitude, climate, elevation, and local weather patterns.
Some regions receive consistently strong sunlight, while others experience frequent cloud cover or pronounced seasonal differences.
Annual production estimates should use local historical solar-resource data.
2. Panel Orientation
The direction a solar panel faces affects how sunlight reaches its surface throughout the day.
In much of the Northern Hemisphere, equator-facing panels generally favor southern orientations for annual energy production.
In the Southern Hemisphere, equator-facing panels generally favor northern orientations.
However, the best orientation for a particular property can also depend on shading, roof design, electricity tariffs, and when the household consumes electricity.
East- and west-facing installations can still produce useful energy.
3. Roof Tilt
Solar panel tilt affects how directly sunlight strikes the module.
The optimal angle depends on location and the desired seasonal production pattern.
A roof with a less-than-ideal tilt can still be suitable for solar.
4. Temperature
Solar panels need sunlight, but excessive heat can reduce their electrical output.
A panel rated at 450W under laboratory conditions may produce less power when its cells become significantly hotter than the standard test temperature.
The exact effect depends on the module’s temperature coefficient.
For example, if a panel has a power temperature coefficient of -0.35% per °C, a cell temperature 20°C above the reference temperature would correspond to approximately a 7% power reduction attributable to temperature alone.
This is a simplified illustration based on the stated coefficient.
5. Shading
Shadows from trees, chimneys, nearby buildings, and other structures can reduce solar production.
The impact depends on the location and duration of the shade, panel electrical design, and system configuration.
Even partial shading may affect more than one module in certain string-inverter arrangements.
Microinverters or module-level power electronics can help manage some mismatch and shading effects, but they do not eliminate the loss of sunlight.
6. Dust and Dirt
Accumulated dust, pollen, bird droppings, and other debris can reduce the sunlight reaching solar cells.
The effect varies by environment and rainfall.
Routine inspection and appropriate cleaning may help maintain performance, but homeowners should follow manufacturer instructions and avoid unsafe roof access.
See our Solar Panel Maintenance Cost Guide for additional maintenance considerations.
7. Panel Age and Degradation
Solar panels gradually lose some output capability over time.
The degradation rate varies by product, environmental exposure, and operating conditions.
Manufacturer performance warranties can help you understand the minimum warranted output over a specified period.
For more context, read How Long Do Solar Panels Last on a Roof?.
8. Inverter Efficiency
Solar panels produce direct current (DC) electricity.
Most conventional household electrical systems use alternating current (AC).
An inverter converts DC electricity into AC electricity, with some energy lost during conversion.
When estimating usable household electricity, inverter efficiency matters.
This is also why DC panel capacity and AC electricity output should not be treated as identical measurements.
Solar Panel Output in the USA, UK, Canada, and Australia
Solar production varies considerably across different countries and climates.
A solar panel’s rated wattage does not change simply because it is installed in another country, but the amount of electricity it generates can change substantially.
United States
The United States includes a wide range of solar conditions.
Properties in the Southwest often have strong solar resources, while cloudier or more northern locations may experience lower average irradiance.
However, local shading, roof orientation, and seasonal weather can be just as important as the state in which a home is located.
For U.S. homeowners, the PVWatts Calculator is a useful tool for estimating production using local solar data.
United Kingdom
The UK experiences pronounced seasonal differences in daylight and solar irradiance.
A rooftop installation can generate useful electricity throughout the year, but summer production is generally much higher than winter production.
When comparing monthly electricity generation, avoid assuming that annual output is divided evenly across all 12 months.
Canada
Canadian solar installations must account for regional differences in sunlight, winter conditions, and potential snow coverage.
Cold temperatures can support solar module electrical performance under adequate sunlight, but shorter winter days, snow, and seasonal solar angles can reduce production.
A realistic forecast should model these effects rather than relying only on a single daily average.
Australia
Many Australian regions have favorable solar resources.
However, high module temperatures, roof orientation, shading, and seasonal conditions still affect electricity generation.
In the Southern Hemisphere, north-facing panels are often favorable for annual production, although other orientations can be appropriate depending on the household’s needs.
The key takeaway: Use local solar-resource data for every country rather than assigning a universal daily output to a solar panel.
How Much Electricity Does a Full Solar Panel System Produce?
The total energy generated by a solar installation depends on its combined panel capacity.
For example:
Ten 450W panels provide:
10 × 450W = 4,500W
That equals 4.5kW of rated DC capacity.
Under four peak sun hours and 80% overall energy delivery:
4.5 × 4 × 0.80 = 14.4 kWh per day
Solar System Output by Capacity
| Solar system capacity | Daily output | Monthly output | Yearly output |
|---|---|---|---|
| 1 kW | 3.2 kWh | 96 kWh | 1,168 kWh |
| 2 kW | 6.4 kWh | 192 kWh | 2,336 kWh |
| 3 kW | 9.6 kWh | 288 kWh | 3,504 kWh |
| 4 kW | 12.8 kWh | 384 kWh | 4,672 kWh |
| 5 kW | 16.0 kWh | 480 kWh | 5,840 kWh |
| 6 kW | 19.2 kWh | 576 kWh | 7,008 kWh |
| 8 kW | 25.6 kWh | 768 kWh | 9,344 kWh |
| 10 kW | 32.0 kWh | 960 kWh | 11,680 kWh |
All estimates use four peak sun hours per day and an illustrative 80% energy-delivery factor. Monthly values assume 30 days; yearly values assume 365 days.
These figures are useful for comparing system capacities, but they are not substitutes for location-specific production forecasts.
If you are considering a smaller installation, our 3kW Solar System Guide explains how a 3kW system’s production relates to household electricity needs.
You can also use the Solar System Size Calculator to estimate an appropriate installation size.
How Many Solar Panels Do You Need to Produce 1,000 kWh per Month?
Suppose your goal is to generate approximately 1,000 kWh of solar electricity in a 30-day month.
Assume:
450W solar panels
Four peak sun hours daily
An 80% overall energy-delivery factor
Each panel generates approximately:
0.45 × 4 × 0.80 = 1.44 kWh daily
Over 30 days:
1.44 × 30 = 43.2 kWh per panel
Now divide your target electricity generation by the estimated monthly output per panel:
1,000 ÷ 43.2 = 23.15 panels
Since you cannot install a fraction of a standard module, round up.
Estimated requirement: 24 panels rated at 450W each.
That represents a 10.8kW DC solar array.
Under the example conditions, its calculated monthly output would be:
10.8 × 4 × 0.80 × 30 = 1,036.8 kWh
This is an energy-generation estimate, not a guarantee that your electricity bill will be zero.
Electricity imports, exports, utility charges, and time-of-use pricing can affect actual savings.
For detailed household sizing, read our How Many Solar Panels Do I Need? guide.
Does Higher Solar Panel Wattage Always Mean Better Performance?
Not necessarily.
A 500W panel has a higher rated output than a 400W panel, but that does not automatically make it more efficient.
A higher-wattage panel may simply be physically larger.
Solar panel efficiency describes the percentage of incoming solar energy converted into electrical power under specified conditions.
For example, consider two panels:
Panel A: 400W, 20% efficiency
Panel B: 450W, 20% efficiency
Panel B has a higher rated output, but both panels have the same conversion efficiency.
Under comparable standard test conditions, the difference in wattage may be explained by a difference in module area.
When choosing panels for a home, compare:
Rated maximum power
Module efficiency
Physical dimensions
Temperature coefficient
Product and performance warranties
Degradation specifications
Installation compatibility
Total installed cost
The most appropriate option depends on the property and overall solar system design.
How to Estimate Your Solar Panel Output More Accurately
A simple wattage-based calculation is useful for understanding solar energy production.
However, homeowners planning an installation should consider a more detailed estimate.
Start by identifying your location and available roof area.
Then assess shading, roof direction, tilt, and the solar panel specifications you intend to use.
A realistic production forecast should also consider:
Local weather patterns
Seasonal irradiance changes
Temperature-related performance
Inverter efficiency
Wiring and miscellaneous system losses
Equipment availability
Long-term panel degradation
The Solar Production Calculator can help you explore solar electricity generation using your selected inputs.
For a more detailed location-specific simulation, use PVWatts.
Before purchasing equipment, have a qualified solar installer verify the system design and expected production.
Can Solar Panels Produce Electricity on Cloudy Days?
Yes. Solar panels can generate electricity when sunlight is diffuse rather than direct.
However, output is usually lower during heavily overcast conditions than under strong direct sunlight.
The amount of electricity produced depends on cloud density, available irradiance, module technology, and other conditions.
A cloudy day does not necessarily mean zero solar production.
Likewise, a clear day does not guarantee maximum rated power because module temperature and solar angle also affect output.
Do Solar Panels Generate Electricity at Night?
Conventional photovoltaic solar panels do not generate meaningful electricity at night because there is insufficient sunlight.
A grid-connected home normally draws electricity from the utility when solar generation is unavailable.
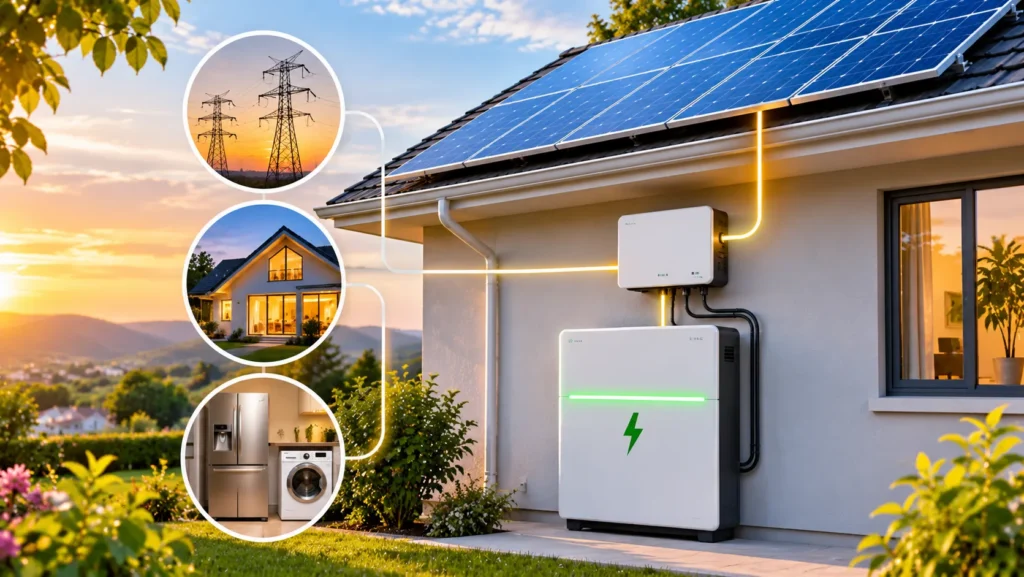
A home with a compatible battery storage system may use previously stored electricity after sunset.
However, a battery does not increase the total energy generated by the solar panels. It stores energy for later use, subject to charging and discharging losses.
If you want to estimate storage requirements, use our Solar Battery Calculator.
How Does Solar Panel Output Affect Electricity Savings?
Higher electricity generation can potentially reduce the amount of electricity a household purchases from its utility.
However, solar output and financial savings are not interchangeable.
Actual savings depend on:
Electricity rates
Household consumption
Solar self-consumption
Utility export compensation
Time-of-use tariffs
Fixed utility charges
Installation cost
Equipment maintenance
Applicable local incentives
For example, a system producing 500 kWh in a month does not necessarily reduce a household’s bill by 500 times its retail electricity rate.
Some electricity may be exported at a different compensation rate, while other electricity may be consumed directly.
To explore installation economics, use the Solar Cost Calculator and Solar ROI Calculator.
Common Mistakes When Estimating Solar Panel Output
Accurate solar planning requires more than multiplying a panel’s wattage by the number of daylight hours.
Assuming Rated Wattage Is Constant Output
A 450W panel does not continuously produce 450W throughout the day.
Its output changes with sunlight intensity, temperature, and operating conditions.
Confusing Watts With Kilowatt-Hours
Watts measure power. Kilowatt-hours measure energy over time.
Use kWh when comparing solar generation with electricity bills.
Using Total Daylight Hours Instead of Peak Sun Hours
Daylight hours do not represent equivalent full-intensity sunlight hours.
Using total daylight hours can substantially overestimate production.
Ignoring Seasonal Changes
Monthly solar production changes with the seasons.
A yearly estimate divided by 12 may be useful for a simple average, but it does not describe actual monthly generation.
Ignoring Shading and Temperature
Even a high-efficiency panel may underperform if installed in heavy shade or exposed to unfavorable operating conditions.
Double-Counting System Losses
When using a detailed production model, do not apply additional loss factors for effects the model already includes.
For example, PVWatts models temperature and inverter conversion separately from its miscellaneous system-loss input.
Assuming More Panels Always Mean Better Financial Returns
A larger array can generate more electricity, but the economic benefit depends on system cost, consumption, utility policies, and available installation space.
Frequently Asked Questions
How much power does a solar panel produce per day?
A modern residential solar panel rated between 400W and 460W can produce approximately 1.28–1.47 kWh per day under four peak sun hours and an 80% energy-delivery factor. Actual output depends on local conditions.
How much energy does one solar panel produce in a month?
A 450W panel generates approximately 43.2 kWh over 30 days under the example assumptions used in this guide. Actual monthly production varies by season, location, and installation conditions.
How many kWh does a 400W solar panel produce?
A 400W panel produces approximately 1.28 kWh daily, 38.4 kWh over 30 days, or 467.2 kWh over 365 days under four peak sun hours and 80% energy delivery.
How much electricity does a 500W solar panel generate?
Under the same assumptions, a 500W panel generates around 1.6 kWh per day, 48 kWh over 30 days, and 584 kWh over 365 days.
How many watts does a solar panel produce per hour?
Watts are already a measurement of power, not energy per hour. A 450W panel can deliver 450 watts of instantaneous DC power under its standard rating conditions. If it maintained that output for one hour, it would produce 450 watt-hours, or 0.45 kWh, before relevant downstream losses.
How much energy can a solar panel produce in a year?
Annual production depends on wattage and location. For example, a 450W panel produces approximately 525.6 kWh annually under the simplified assumption of four daily peak sun hours and 80% energy delivery throughout the year.
Does a 600W solar panel produce twice as much electricity as a 300W panel?
Under identical sunlight conditions and the same proportional energy losses, a 600W panel would produce twice the electricity of a 300W panel. Actual performance may differ because of module characteristics and installation conditions.
Do solar panels work in winter?
Yes. Solar panels can produce electricity in winter when sunlight is available. However, shorter days, seasonal solar angles, cloud cover, and snow may reduce output. Cold temperatures can benefit module electrical performance under otherwise comparable sunlight conditions.
Can one solar panel power a refrigerator?
A single panel may generate enough energy over a day to match some refrigerators’ daily consumption, but reliable operation requires more than an energy comparison. Refrigerator startup power, inverter capacity, sunlight availability, and battery or grid backup must also be considered.
How can I calculate solar panel output for my location?
Start with panel wattage, local peak sun hours, and realistic system-loss assumptions. For a more detailed estimate, use a location-specific solar production model such as PVWatts and verify the final design with a qualified installer.
Final Thoughts: How Much Power Does a Solar Panel Really Produce?
The answer to “how much power does a solar panel produce?” depends on whether you’re asking about its rated wattage or the electricity it generates over time.
A modern residential solar panel may be rated around 400–460W, but its actual daily electricity generation depends on sunlight, location, temperature, orientation, shading, and system performance.
Under the illustrative conditions used throughout this guide:
A 400W panel produces about 1.28 kWh per day.
A 450W panel produces about 1.44 kWh per day.
A 500W panel produces about 1.60 kWh per day.
A 600W panel produces about 1.92 kWh per day.
These figures are useful starting points, not guaranteed results.
For the most accurate planning estimate, use local solar-resource data and realistic equipment assumptions.
Want to estimate your own solar electricity generation? Try the free Solar Production Calculator and explore how panel capacity and solar conditions affect your potential output.
Disclaimer: All simplified production tables and calculations in this article are illustrative. Actual electricity generation varies by location, weather, equipment, installation design, and operating conditions. Consult a qualified solar professional before making installation or purchasing decisions.